

WEST MICHIGAN — Take a look at the attached map! Note the huge polar vortex or low over the Great Lakes. After the passage of an Arctic front, these polar lows typically lie in their wake and are found at higher latitudes like Canada and the northern United States.
They carve out a huge trough in the upper level winds or jet stream. That trough or dip allows the cold air to plunge, or surge southward. In this case for the Great Lakes, our temperatures will shake-out to be far lower than temperatures 2,000 miles north/west in Alaska and western Canada. A polar vortex is best analyzed at about 18,000 feet above the surface or about the 500 millibar level.
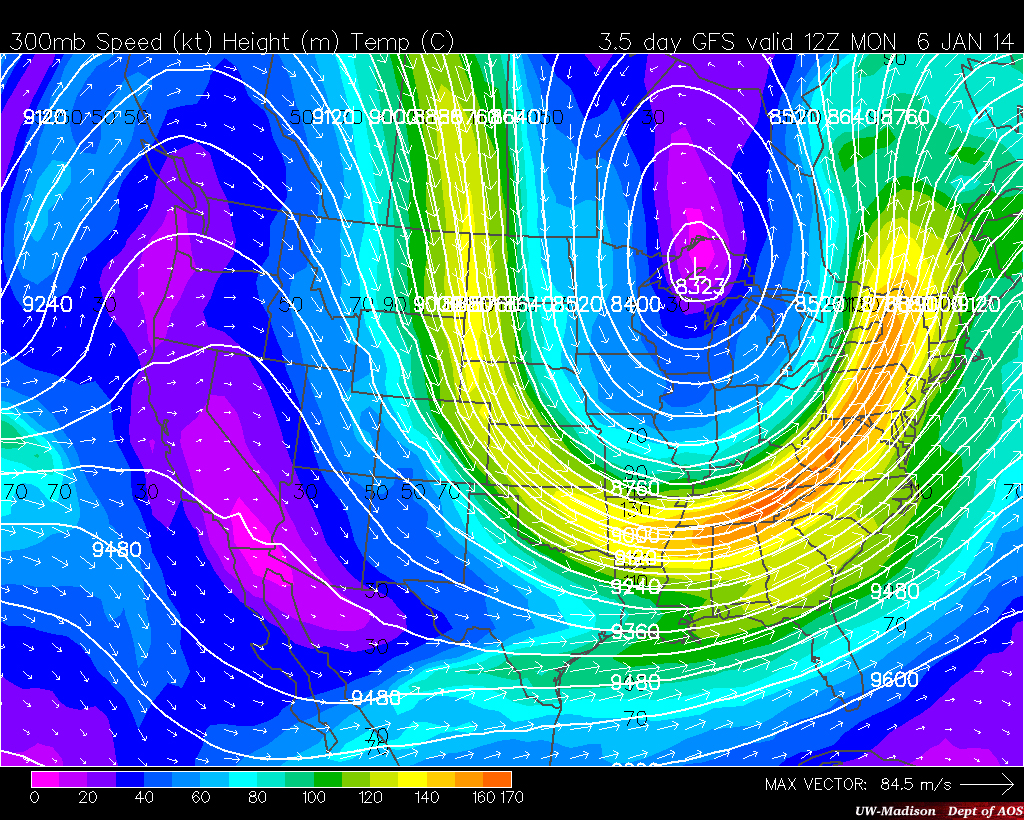
Take a look at the image above. This is the jet stream on the 300 millibar map around 30,000 feet. Trace the outline of yellow from Canada, through the south-central states, over the Mid-Atlantic, and through the Northeast. That’s the course of our jet stream with a major dip or trough over much of the nation. That trough corresponds to the Arctic air mass and cold weather on the map below that are temperatures at 850 millibars or about 5,000 feet above the surface.

Note on the above map the air masses about 5,000 feet above the surface. Clearly, the coldest temperatures can be found in red and yellow (inside the upper trough) over the Upper Midwest and Great Lakes. The temperatures range anywhere from -25 to -36 degrees Celsius. That translates to -13 to -32 in Fahrenheit. It will actually be warmer than that at the surface and ultimately end up around 0 to 5 above. All maps are from the GFS forecast model and are valid for 12Z Monday morning (about 7:00 AM EST).
Strong winds will have “feels like” temperatures running about -25 to -35 degrees…dangerously cold for extended or prolonged exposure, especially without being properly dressed. You can always get radar, satellite, temperatures, and wind chill information by going to www.fox17online.com/weather.
Check out the wind chill chart from the National Weather Service below. Wind speed is on the left, air temperature is across the top. Note how the frostbite times increase as temperature decreases and wind increases. The numbers in the colored grid indicate the “feels like” temperatures on our skin with the temperature and wind combination. Get the NWS full link and description here.

